Serendipity!
The »Cybernetic Serendipity« Exhibition is a milestone in the history of computer art.
It was held between August 1 and October 20, 1968, at the ICA, the Institute of Contemporary Art, Nash House, The Mall, London.
In »Serendipity!« we present the lithographs printed for the Cybernetic Serendipity collector´s set in 1968.
The works presented below are available.
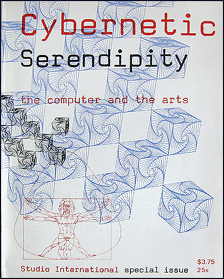
Cybernetic Serendipity
1968, three years after the first computer art exhibitions had been held at small galleries in Stuttgart and New York, the first large and internationally recognized show of digital art took place in London.
Jasia Reichardt, the curator of »Cybernetic Serendipity«, presented the complete bandwidth of early computer art by displaying works of 325 computer artists - from computer generated music, literature, graphics and films to different objects, sculptures and robots and also displaying state of the art hardware and its capabilities.
The inspiration for this legendary show came from Max Bense, who had organized the first computer art exhibition ever 1965 in Stuttgart, Germany, presenting works of Georg Nees. Read more on Max Bense on our red 40+1 page.
The London exhibition, which drew about 50.000 visitors, later traveled to the U.S. where a lean version of »Cybernetic Serendipity« was shown at the
Corcoran Gallery in Washington D.C. and at The Exploratorium in San Francisco.
The Institute of Contemporary Arts has a documentation of the exhibition in the
ICA Archive.

Cyber What?
The meaning of the exhibition title is defined in the catalogue:
Cybernetic: »adj. of cybernetics - a science of control and communication in complex electronic machines like computers and the human nervous system«
Serendipity: »the faculty of making happy chance discoveries«
In the exhibition´s press release Reichardt explains, that the term serendipity was coined by Horace Walpole in 1754 for happy chance discoveries. Walpole was inspired by the legend of the three princes of Serendip (historical name of Sri Lanka), who made multiple surprising discoveries while travelling, which offered them unplanned and lucky chances.
See Wikipedia: Serendipity, The Three Princes ....
The term cybernetic, used by Norbert Wiener in his book »Cybernetics«, 1948, in the context of data processing the first time,
developed into the prefix cyber, which today is heavily used, mostly to describe internet or virtual space phenomenons.
See Wikipedia: Cybernetics.
The Catalogue
|

|
Cybernetic Serendipity
- the computer and the arts.
Studio International special issue
The first edition was published in July 1968, followed by a (revised) second edition in September and reprints in November 1968, in the U.S. in 1969 and again in 1970.
Meanwhile, in 2018, a
50th anniversary reprint was released by studio international.
cover design: Franciszka Themerson, incorporating the computer graphics »3 D« by Donald K. Robbins / »Circle to Square transformation of Leonardo da Vinci´s interpretation of Vitruvius´ theory of proportion« by Charles Csuri / »The result of Fourier analysis on X-ray crystallography of the molecular structure or chicken fat« by B.L. Kershaw (on back side).
|
Jasia Reichardt, curator of Cybernetic Serendipity, also edited the exhibition catalogue, a special issue of the modern art journal Studio International: Cybernetic Serendipity - the computer and the arts.
Franciszka Themerson, who did the exhibition design, designed the cover.
The Motif Edition
In 1968 Motif Editions, a London based publisher of fine art prints, released a Cybernetic Serendipity collector´s set containing
seven lithographs. The lithographs were printed after plotter drawings.
These lithographs are part of important computer art collections like the one of the
Victoria and Albert Museum in London.
All these computer graphics, which are also shown in the catalogue, were created by Japanese and American pioneers of computer art:
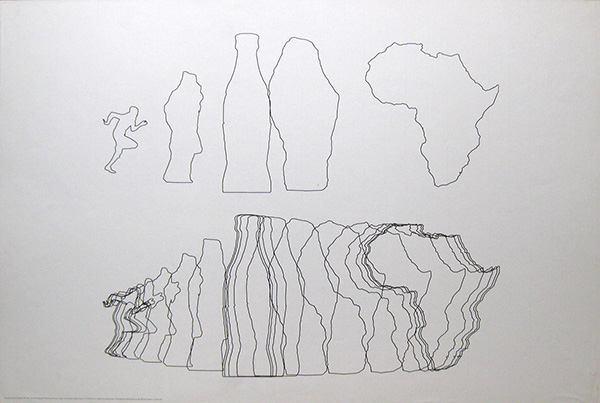
Running Cola is Africa
|
|
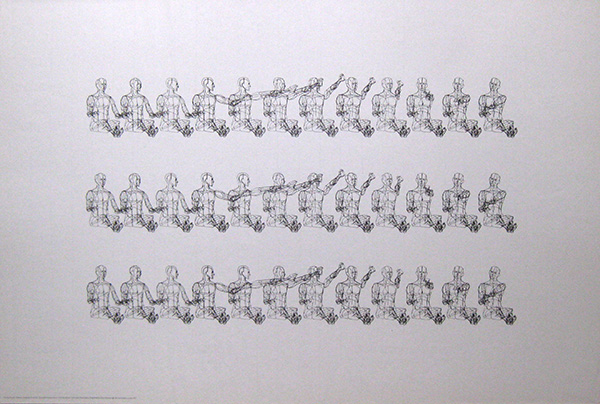
CTG - Computer Technique Group:
Running Cola is Africa
lithograph after plotter drawing, 1968
Idea by Masao Komura, Data by Makoto Ohtake, Programmed by Koji Fujino. Realization with support of IBM Japan.
The graphic was generated 1967/68 at IBM Scientific Data Centre in Tokyo, Japan.
Programmed in Fortran IV on IBM 7090 and drawn on Calcomp 563 plotter.
|
The Computer Technique Group from Japan contributed 24 computer graphics and also works of computer poetry to the Cybernetic Serendipity exhibition. »Running Cola is Africa« is one of the graphics listed in Jasia Reichardt´s Cybernetic Serendipity catalogue in the category Metamorphoses: »A computer algorithm converts a running man into a bottle of cola, which in turn is converted into the map of Africa.«
This graphic is one of the earliest examples of morphing, image transformation by computer.
The members of the CTG according to the catalogue were: Haruki Tsuchiya (systems engineer), Masao Komura (product designer), Kuni Yamanaka (aeronautic engineer); Junichiro Kazizaki (electronic engineer), Makoto Ohtake (architectural designer), Koji Fujino (systems engineer)
and Fujio Niwa (systems engineer).
´
Return to Square
|
|
CTG - Computer Technique Group:
Return to Square
lithograph after plotter drawing, 1968
Idea by Masao Komura, programmed by Kunio Yamanaka. Realization with support of IBM Japan.
Generated 1967/68 at IBM Scientific Data Centre in Tokyo, Japan.
Programmed in Fortran IV on IBM 7090 and drawn on Calcomp 563 plotter.
|
»Return to Square« also belongs to the Metamorphoses graphics mentioned above and is also an early example of morphing. As Jasia Reichardt´s Cybernetic Serendipity catalogue describes: »A square is transformed into a profile of a woman and then back into a square, programmed according to an arithmetic series.« This motif is listed as »Return to Square (a)«, a second motif, (b), was programmed according to geometrical progression.
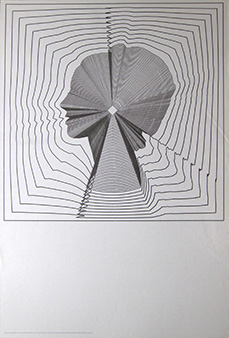
Asymmetry (Maughanogram)
|
|
Maughan S. Mason:
Asymmetry (Maughanogram)
lithograph after plotter drawing, 1968
(the signature is printed - and the moiré pattern was intended by the artist)
This graphic was generated 1966 by an analog computer and drawn by a XY plotter.
|
»Asymmetry« is one of the so called Maughanograms created by the American computer artist Maughan Sterling Manson. This graphic and two other Maughanograms are depicted in the Cybernetic Serendipity catalogue. Before the London exhibition these graphics had been on display at the Salt Lake Art Center, Salt Lake City, Utah.
The moiré pattern in this graphic was intended and created by the artist.
Maughan S. Manson (1931 - 2003) had a MS in Physics, was president of the Society for Computer Simulation and had worked for IBM as a computer programmer for 25 years.
Human Figure
|
|
William Fetter / Boeing Computer Graphics:
Human Figure
lithograph after plotter drawing, 1968
Generated 1968 (according to V&A).
Hardware: Keypunch, IBM/reader printer, IBM 7094, Gerber plotter.
|
»Human Figure« depicts a pilot performing a sequence of movements. The figure was created for the aircraft company Boeing to study and optimize the location of cockpit instruments. The results of these studies then were used to develop the Boeing 747 cockpit.
William Fetter (1928 - 2002) worked for Boeing as an art director in the 1960s where he created the first computer model of the human body in 1964, the »Boeing Man«.
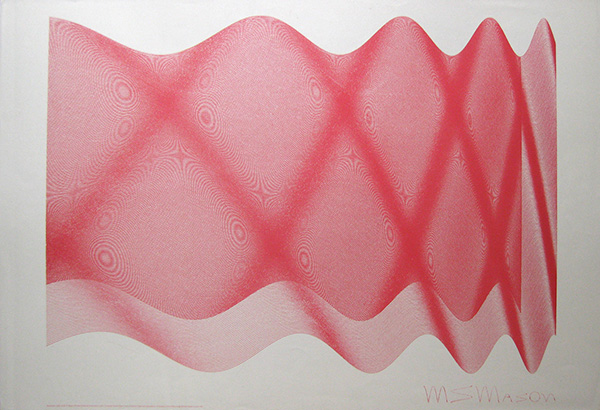
The Snail
|
|
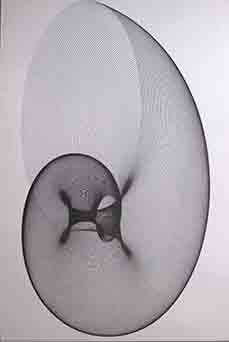
Kerry Strand / California Computer Products: The Snail
lithograph after plotter drawing, 1968
The graphic has a moiré pattern.
Generated 1967 on a Calcomp 770 tape system, drawn on Calcomp 702 flatbed plotter.
|
»The Snail« was one of 7 computer graphics by different artists presented by CalComp in the Cybernetic Serendipity exhibition, also to demonstrate the capability of the CalComp plotting system. Plotting time for »The Snail« had been 4.5 hours.
Kerry Strand (born 1940) studied engineering and physics and worked for CalComp Technology, Anaheim, California, from 1966 to 1972. CalComp or California Computer Products produced computer hardware like the CalComp plotters.
Random War
|
|
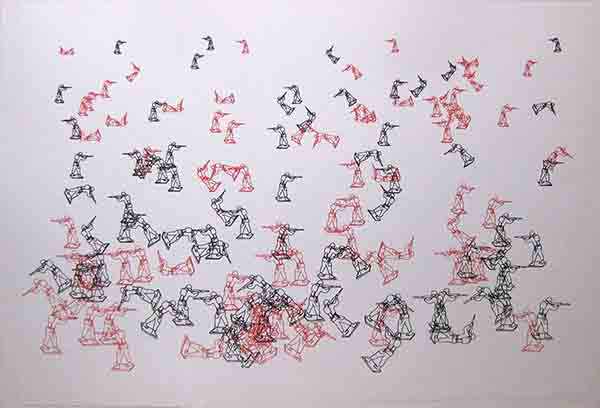
Charles Csuri and James Shaffer / Ohio State University:
Random War
lithograph after plotter drawing, 1968
Generated in 1967 at Ohio State University.
|
»Random War« is the result of an early computer model trying to predict the outcome of an imaginary battle with few variables. As the 1968 Motif Edition text sheet describes it: »A drawing was made of one toy soldier which provided data for the basic element of the composition. A random number generator was used in the programme to determine the distribution and position of the soldiers on the battlefield. One side is red, and other black, and the name of real people were given to each soldier. Their military ranks were assigned by the random number generator. The programme also had an automatic control for perspective. A picture 30x100 inches of the battle was produced, and the printout gave the following information : Total number of dead and wounded in alphabetical order - The survivors in alphabetical order.«
Charles Csuri (born 1922) is an artist and one of the pioneers of computer art.
Together with James Shaffer he created quite a few iconic works of early computer art at Ohio State University.
In 2012 Csuri developed an online game based on Random War.
3D Checkerboard Pattern
|
|
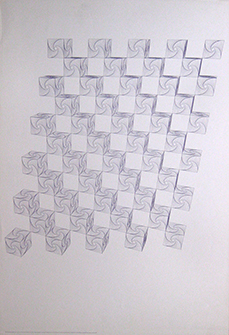
Donald K. Robbins / Sandia Corporation:
3D Checkerboard Pattern
lithograph after plotter drawing, 1968
Generated ca. 1968
|
»3D Checkerboard Pattern« is one of the iconic graphics of the Cybernetic Serendipity exhibition. It was used for the cover of the exhibition catalogue.
As the 1968 Motif Edition text sheet describes it, this graphic visualizes the »bug problem« in calculus:
»If four bugs are placed on the corners of a square and crawl towards each other, what path will they follow?« A basic pattern is created.
The resulting graphic reproduces this basic pattern into a checkerboard and a »further progression shows the checkerboard as a three-dimensional entity,
with a shape distorted by perspective transformations.«
|
|
